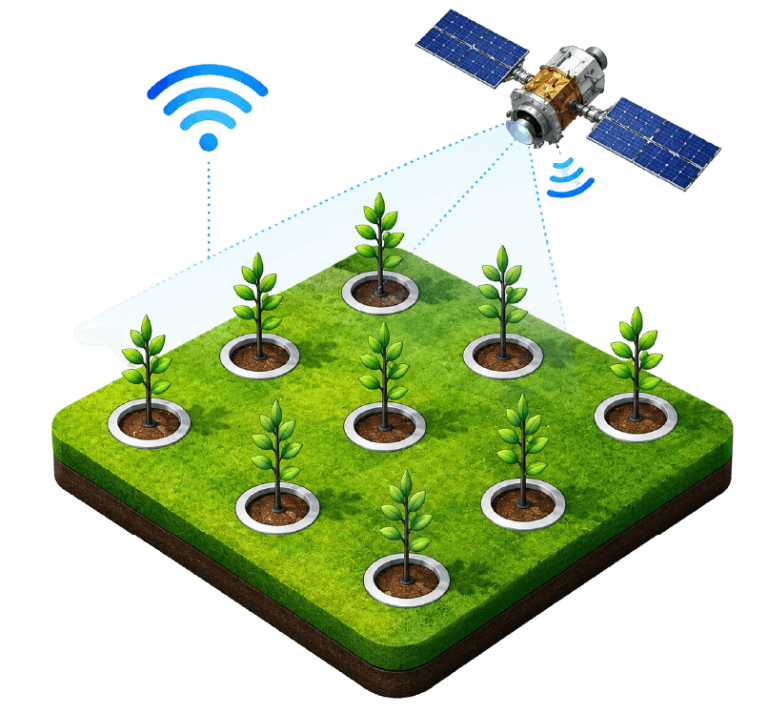
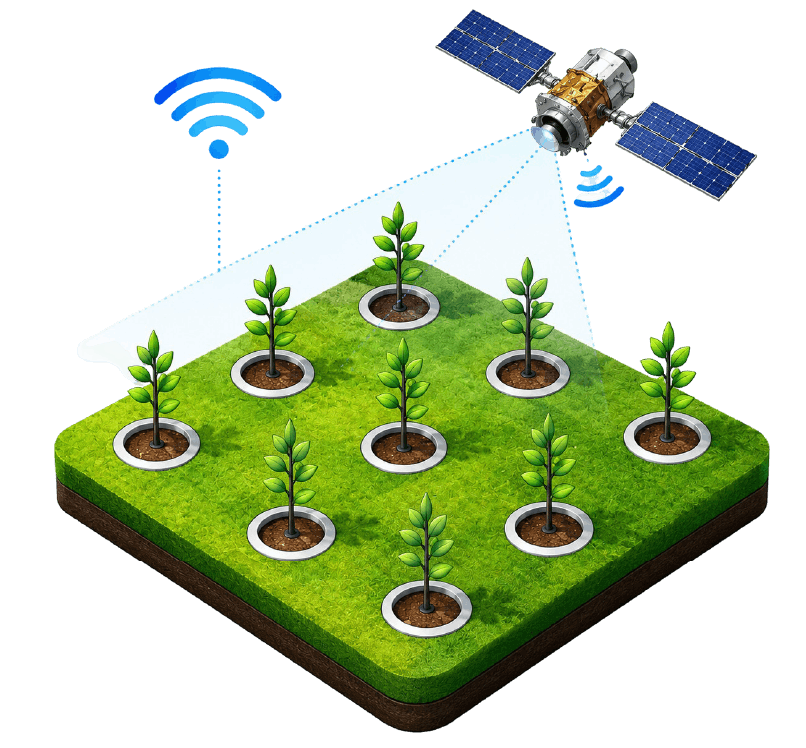
Optical satellites cannot see through cloud. Sentinel-2 revisits the same ground every few days, but over a growing season a meaningful fraction of those passes come back as cloud rather than crop. What reaches you is not a clean time series; it is a series with holes in it, and the holes are not randomly placed — they cluster in exactly the humid weeks when a paddy is doing something interesting.
The common response is to repair the series first: interpolate across the gaps, reconstruct what the sensor would have seen, then classify the tidied result. It is a reasonable instinct and a substantial amount of work.
We went the other way. Following Zhao et al. (2021), who showed that convolutional models can classify crop type directly from Sentinel-2 series with high missing rates, we trained a small network to read the gapped signal as it comes. No reconstruction step. The model sees the observations that exist, placed on the calendar where they actually fell, and learns what a season looks like from that.
The result is compact: a dual-head 1D convolutional network of about 74,000 parameters — small enough to be a serious candidate for edge deployment, where compute and power are scarce, and small enough that the interesting constraint turns out to be reading the imagery rather than running the model.
We had been reading aggregate metrics — F1 scores, confusion matrices, learning curves — and they had stopped telling us what to fix. So we built tooling to look at individual mistakes instead, and went through them one at a time: the satellite composite for a misclassified point, its band values, its neighbours.
Cloud is the obvious enemy in optical imagery, and we filtered for it — dropping observations that looked more like cloud than crop. But going through the points we got wrong, a pattern kept recurring: observations at implausibly bright values, cloud tops the filter had passed through and the model had learned from as though they were ground. Cloud is bright in the blue band in a way that vegetation never is, and our filter had not been looking there. Adding that check was a small change, and it made a significant difference.
It was not the only one. Making the water and vegetation indices explicit input channels rather than expecting the network to derive them; adding season-shape features to the classifier head; a final pass that lets neighbouring pixels vote on each other’s predictions — each came out of the same loop. Look at what is actually failing, form one hypothesis, change one thing, verify honestly before keeping it.
None of them was clever in isolation. Together they took us to 98.23.
Our system scored 98.23 on the competition’s algorithm leaderboard, and the combined result earned a Bronze Award in Track 1. (ITU’s announcement of the winners.)
Earth observation is a direction we have been drawn to for some time, and this challenge turned that interest into something concrete. The capability it validates — reading crop type and growth stage from freely available satellite data — is one we think can serve Indian agriculture. Indian cropping is more varied and often double-cropped. We intend to keep working on this capability, and to collaborate with organisations who share that goal.
Share your details below — our experts based out from Bengaluru, India; will connect with you to craft solutions that drive growth, innovation, and impact.